Source: Yipit 3Q22 report for home goods, BLS CPI data
Yipit, a market leader in data research had published the statistics on the Top 30 furniture and home goods companies for the third quarter of 2022. The summary of that research can be found here.
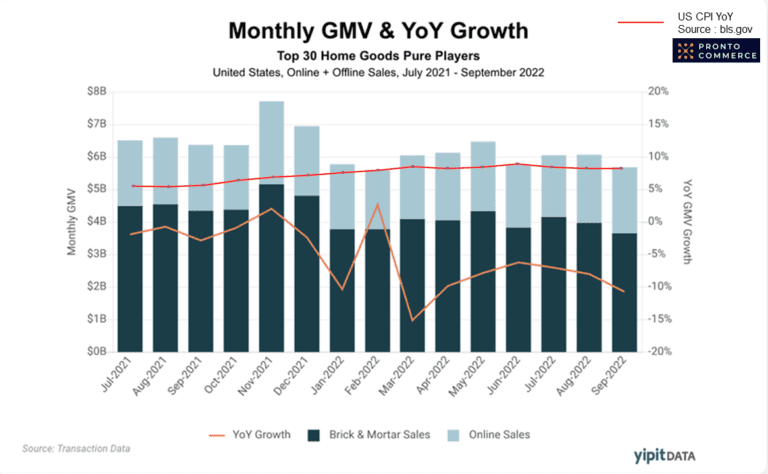
As a top up analysis, we collected the CPI (Consumer Price Index) data for the corresponding period from the office bls.gov website and generated a YoY graph to sync with Yipit graph.
The CPI YoY is shown as a red color line in the graph.
In addition to the analysis presented by Yipit in their report, we can see that, predictably, the drop in overall GMV, as evidenced by the YoY line in the graph, is consistent with the increase in inflation as shown by the red color line graph of YoY changes in the CPI.
Sales of furniture and home goods would continue to be under pressure as disposable income is reduced at higher CPI.